
| FISCAL 2017 | FISCAL 2018 | FISCAL 2019 | FISCAL 2020 | FISCAL 2021 | |
|---|---|---|---|---|---|
| Group Chief Executive Officer | Group Chief Executive OfficerFISCAL 2017
|
||||
| Ratio versus employee average compensation | Ratio versus employee average compensation FISCAL 201738 |
Ratio versus employee average compensation FISCAL 201827 |
Ratio versus employee average compensation FISCAL 201923 |
Ratio versus employee average compensation FISCAL 202013 |
Ratio versus employee average compensation FISCAL 202118 |
| (year to year variance) | (year to year variance)FISCAL 2017+ 5.7% | (year to year variance)FISCAL 2018- 30.0% | (year to year variance)FISCAL 2019- 13.6% | (year to year variance)FISCAL 2020- 41.8% | (year to year variance)FISCAL 2021+ 30.2% |
| Ratio versus employee median compensation | Ratio versus employee median compensation FISCAL 201766 |
Ratio versus employee median compensation FISCAL 201845 |
Ratio versus employee median compensation FISCAL 201940 |
Ratio versus employee median compensation FISCAL 202018 |
Ratio versus employee median compensation FISCAL 202125 |
| (year to year variance) | (year to year variance)FISCAL 2017+ 8.5 % | (year to year variance)FISCAL 2018- 31.6% | (year to year variance)FISCAL 2019- 11.9 % | (year to year variance)FISCAL 2020- 55.5% | (year to year variance)FISCAL 2021+ 42.3% |
- Fiscal 2017
The compensation indicated for the Chief Executive Officer relates to Michel Landel. - Fiscal 2018
The compensation indicated for the Chief Executive Officer is a combination of the compensation of Michel Landel and Denis Machuel prorata temporis during the fiscal year. - Fiscal 2019
The compensation indicated for the Chief Executive Officer is that of Denis Machuel for a full year. - Fiscal 2020
For the Chief Executive Officer, the fixed compensation was reduced by 50% over the second half of the year. In addition, no performance shares were allocated during this fiscal year. For the Chairwoman of the Board of Directors, the fixed compensation was reduced by 50% over the second half of the year. - Fiscal 2021
Fiscal 2021The fixed remuneration of the Chairwoman of the Board of Directors and of the Chief Executive Officer was fully restored and paid.
The Chief Executive Officer did not receive any variable compensation for Fiscal 2020 following the cancellation decided by the Board of Directors given the unprecedented health crisis linked to the Covid-19 pandemic. He received an attribution of performance shares during the fiscal year.
Given the health crisis, Sodexo employees did not receive any variable compensation either for Fiscal 2020. During Fiscal 2021 eligible Sodexo employees received variable compensation for the first half of the year.
The chart below illustrates the evolution of the ratios of the Chairwoman of the Board of Directors and the Chief Executive Officer on the median compensation of employees in the extended scope, in comparison with the Group’s revenue and Operating profit.
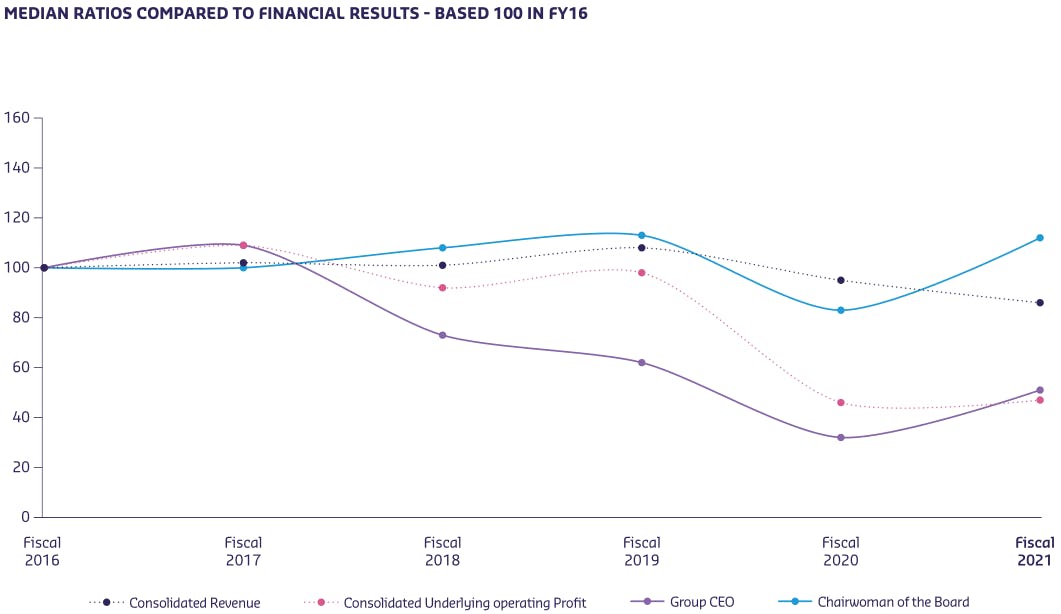
This graph shows us the MEDIAN EQUITY RATIO COMPARED TO FINANCIAL RESULTS - BASE 100 IN FISCAL YEAR 2016.
Fiscal year 2016
Consolidated revenue : 100
Consolidated underlying operating profit : 100
Group CEO : 100
Chairwoman of the Board: 100
Fiscal year 2018
Consolidated revenue : 100
Consolidated underlying operating profit : approximately 90
Group CEO : approximativement 75
Chairwoman of the Board : approximately 105
Fiscal year 2021
Consolidated revenue : approximately 85
Consolidated underlying operating profit : approximately 45
Group CEO : approximately 55
Chairwoman of the Board : approximately 115
For ease of reading, the value of the different items are expressed in base 100 from the previous fiscal year.