
1. Integrated Report
Financial indicatorsFinancial indicators
MARC ROLLAND,
Group Chief Financial Officer


After a year significantly impacted by the pandemic during which Sodexo demonstrated its resilience and the relevance of its business model, our Fiscal 2021 results show a solid pick-up in activity and better than expected performance. Our actions to renegotiate our client contracts, strictly control costs and implement the GET efficiency program are clearly visible in our better-than-expected Underlying operating profit margin. At 483 million euro for the year, our free cash flow has been very positive. Our net debt ratio improved to 1.7, and liquidity is stronger than ever at 6.4 billion euro. We are also actively managing our portfolio of services and activities to enhance the Group’s performance. The recovery is continuing into Fiscal 2022, with ongoing growth and margin improvement.

EVOLUTION OF CONSOLIDATED REVENUESAND ORGANIC GROWTH

Fiscal 2017 : (Group consolidated revenues (in millions of euro) : 20,698, Organic growth(in percentage) : +1.9%
Fiscal 2018 : (Group consolidated revenues (in millions of euro) : 20,407, Organic growth (in percentage) : +1.6%
Fiscal 2019 : (Group consolidated revenues (in millions of euro) : 21,954, Organic growth(in percentage) : +3.6%
Fiscal 2020 : (Group consolidated revenues (in millions of euro) : 19,321, Organic growth(in percentage) : -12.0%
Fiscal 2021 : (Group consolidated revenues(in millions of euro) : 17,428, Organic growth(in percentage) : -5.6%
Revenues by activity
96%
On-site Services
4%
Benefits & Rewards Services
* Including Personal & Home Services.
ON-SITE SERVICES REVENUES BY ACTIVITY AND CLIENT SEGMENT
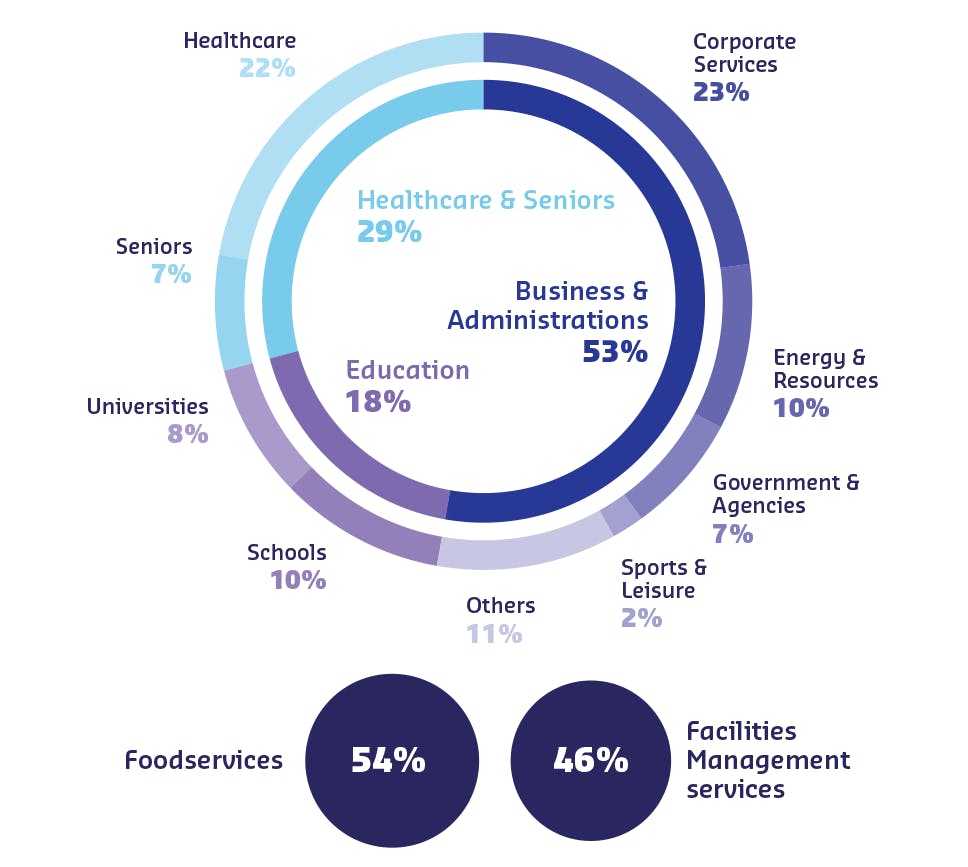
23% Corporate Services
10% Energy & Resources
7% Government & Agencies
2% Sports & Leisure
11% Others
10% Schools
8% Universities
7% Seniors
22% Healthcare
53 % Business & Administrations
18 % Education
29 % Healthcare & Seniors
Foodservices
54%
Facilities Management services
46%
ON-SITE SERVICES REVENUES BY REGION

NORTH AMERICA
39%
6,514
million euro
EUROPE
42%
7,002
million euro
ASIA-PACIFIC, LATIN AMERICA, MIDDLE EAST & AFRICA
19%
3,171
million euro
BENEFITS & REWARDS SERVICES REVENUES BY REGION*
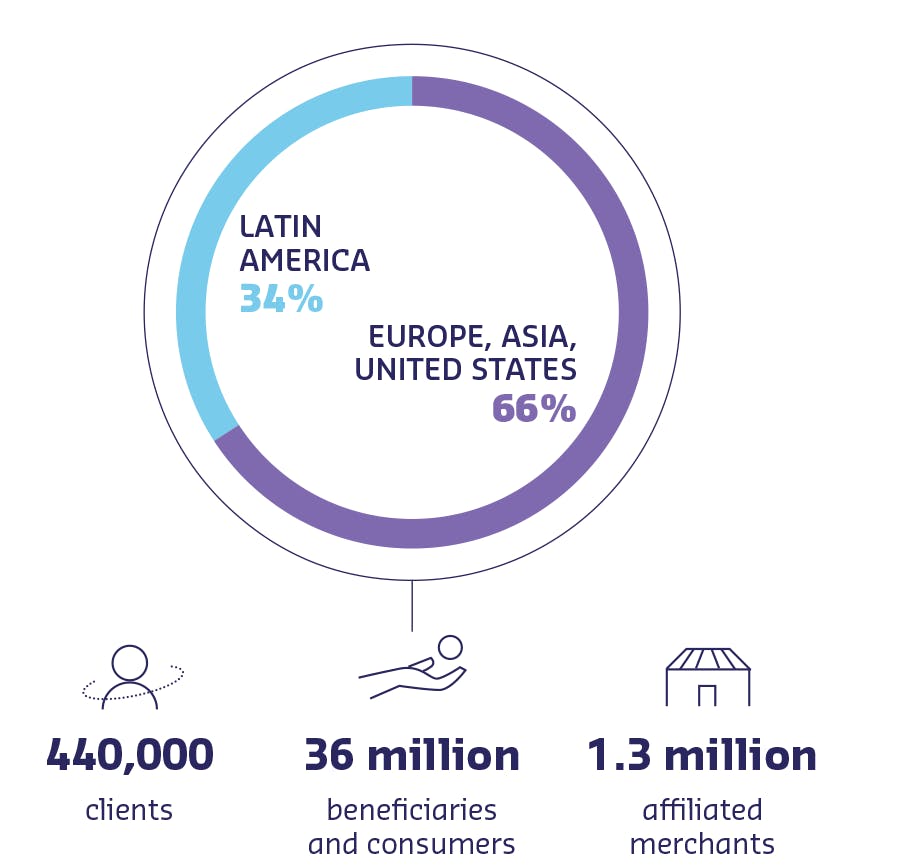
LATIN AMERICA
34%
EUROPE, ASIA, UNITED STATES
66 %
440,000 clients
36 million beneficiaries and consumers
1.3 million affiliated merchants
* Excluding Rydoo revenues.