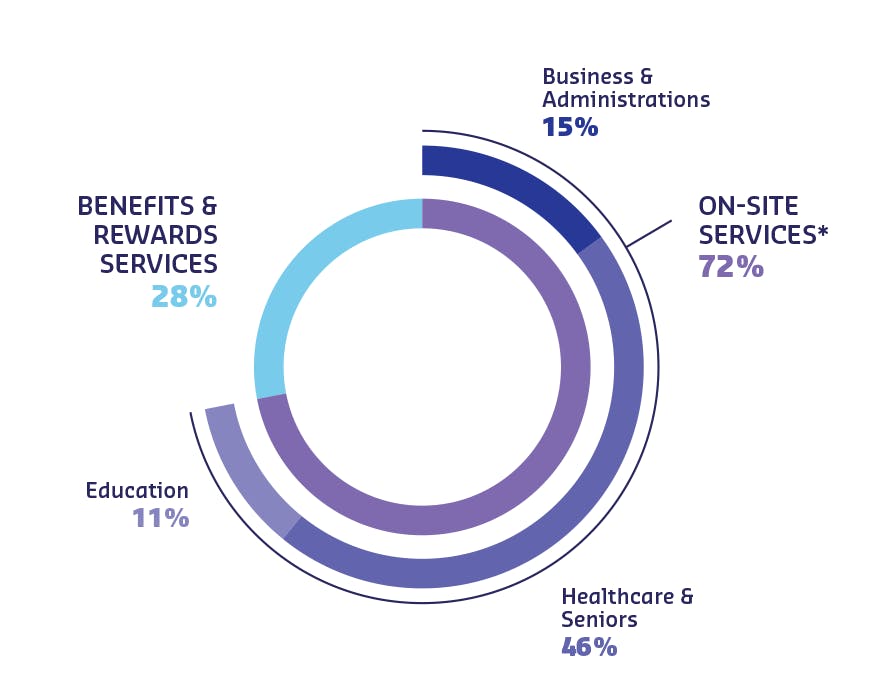
UNDERLYING OPERATING PROFIT BEFORE CORPORATE EXPENSES & INTRAGROUP ELIMINATIONBY ACTIVITY AND CLIENT SEGMENT

15% Business & Administrations
72% ON-SITE SERVICES*
46% Healthcare & Seniors
11% Education
28% BENEFITS & REWARDS SERVICES
* Including Personal & Home Services.
UNDERLYING OPERATING PROFIT AND OPERATING MARGIN

Fiscal 2017 : (Underlying operating profit (in millions of euro) : 1,340, Operating margin (in percentage) : 6.5%
Fiscal 2018 : (Underlying operating profit (in millions of euro) :1,128, Operating margin (in percentage) : 5.5%
Fiscal 2019 : (Underlying operating profit (in millions of euro) : 1,200, Operating margin (in percentage) : 5.5%
Fiscal 2020 : (Underlying operating profit (in millions of euro) : 569, Operating margin (in percentage) : 2.9%
Fiscal 2021 : (Underlying operating profit (in millions of euro) :578, Operating margin (in percentage) : 3.3%
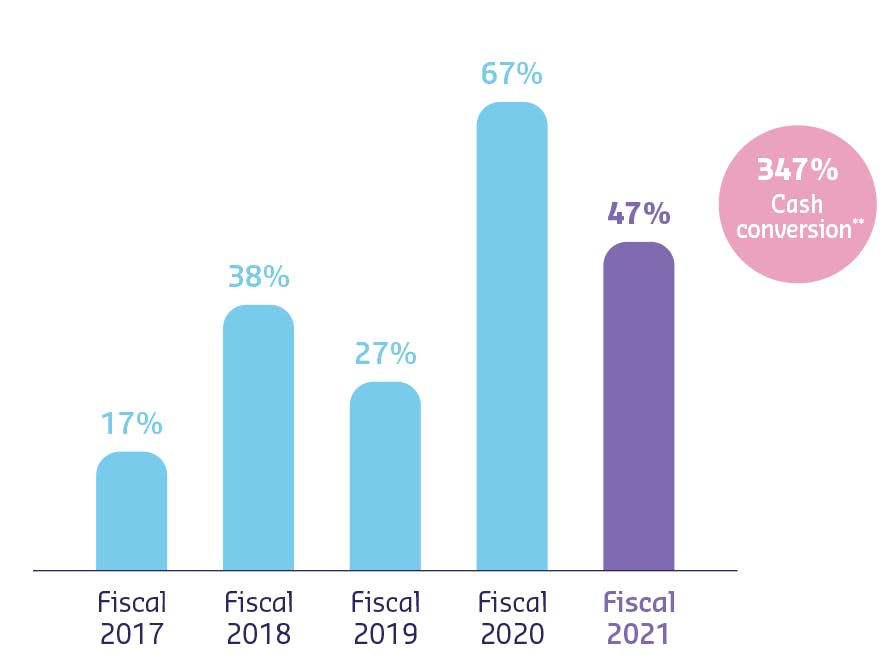
NET DEBT AS A PERCENTAGE OF SHAREHOLDERS’ EQUITY*

Fiscal 2017 : 17%
Fiscal 2018 : 38%
Fiscal 2019 : 27%
Fiscal 2020 : 67%
Fiscal 2021 : 47%
347%
Cash conversion
* Debt net of cash and cash equivalents, restricted cash and financial assets related to Benefits & Rewards Services activity, less bank overdrafts.
** Free cashflow/Net profit.
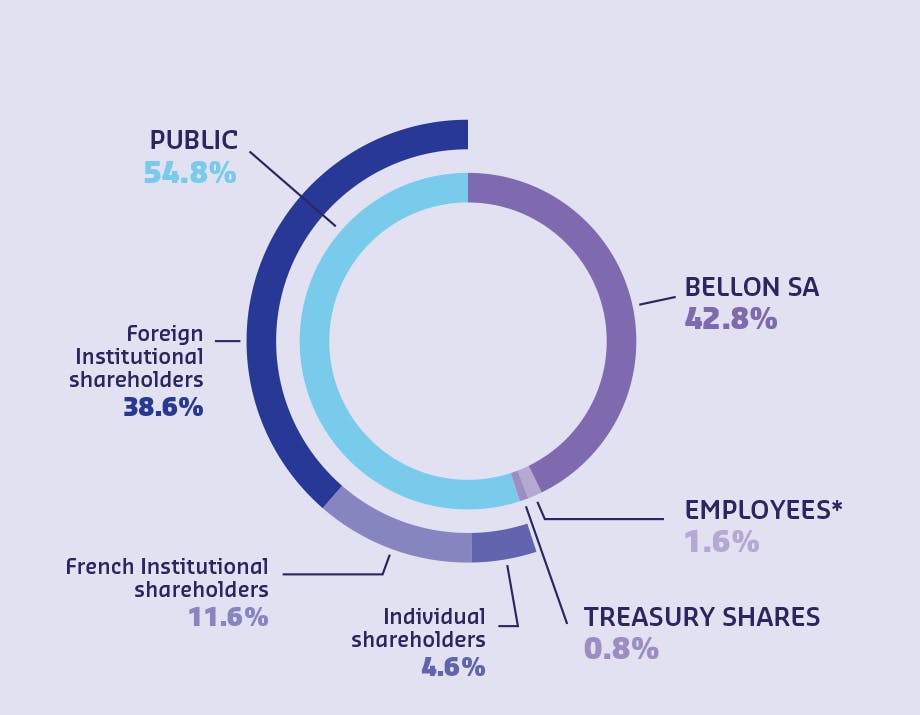
SHAREHOLDERS
AS OF AUGUST 31, 2021

BELLON SA
42.8%
EMPLOYEES*
1.6%
TREASURY SHARES
0.8%
Individual shareholders
4.6%
French Institutional shareholders
11.6%
Foreign Institutional shareholders
38.6%
PUBLIC
54.8%
Source : Nasdaq
* Including shares resulting from restricted share plans held in registered form by employees and still subject to a lock-up period
SODEXO SHARE
DATA SHEET
- Main listing place: Euronext Paris - A Compartment
- ISIN code: FR0000121220
- Mnemonic cod: SW
- Main index: CAC Next 20, SBF 120, CAC 40 ESG, Euronext 100, CAC All Share, FTSE4GOOD
- Euronext listing date: March 2, 1983
KEY INDICATORS
OF FISCAL 2021
as of August 31, 2021
- Total number of shares: 147,454,887 shares
- Closing price: 70.02 euro
- Market capitalization: 10.3 billion euro
- Sodexo share price trend during Fiscal 2021: +16.8%
- CAC 40 trend during Fiscal 2021: +35.0%
- Underlying earnings per share: 2.37euro
- Dividendper share: 2 euro*, which includes a recurring 1.20 euro
- Number of interactions/shareholders meetings: 247 meetings, 314 companies, 544 contacts.
* Submitted for approval at the Shareholders Meeting of December 14, 2021.
For more information, see chapter 3 of the Universal Registration Document.
