Scenario Analysis
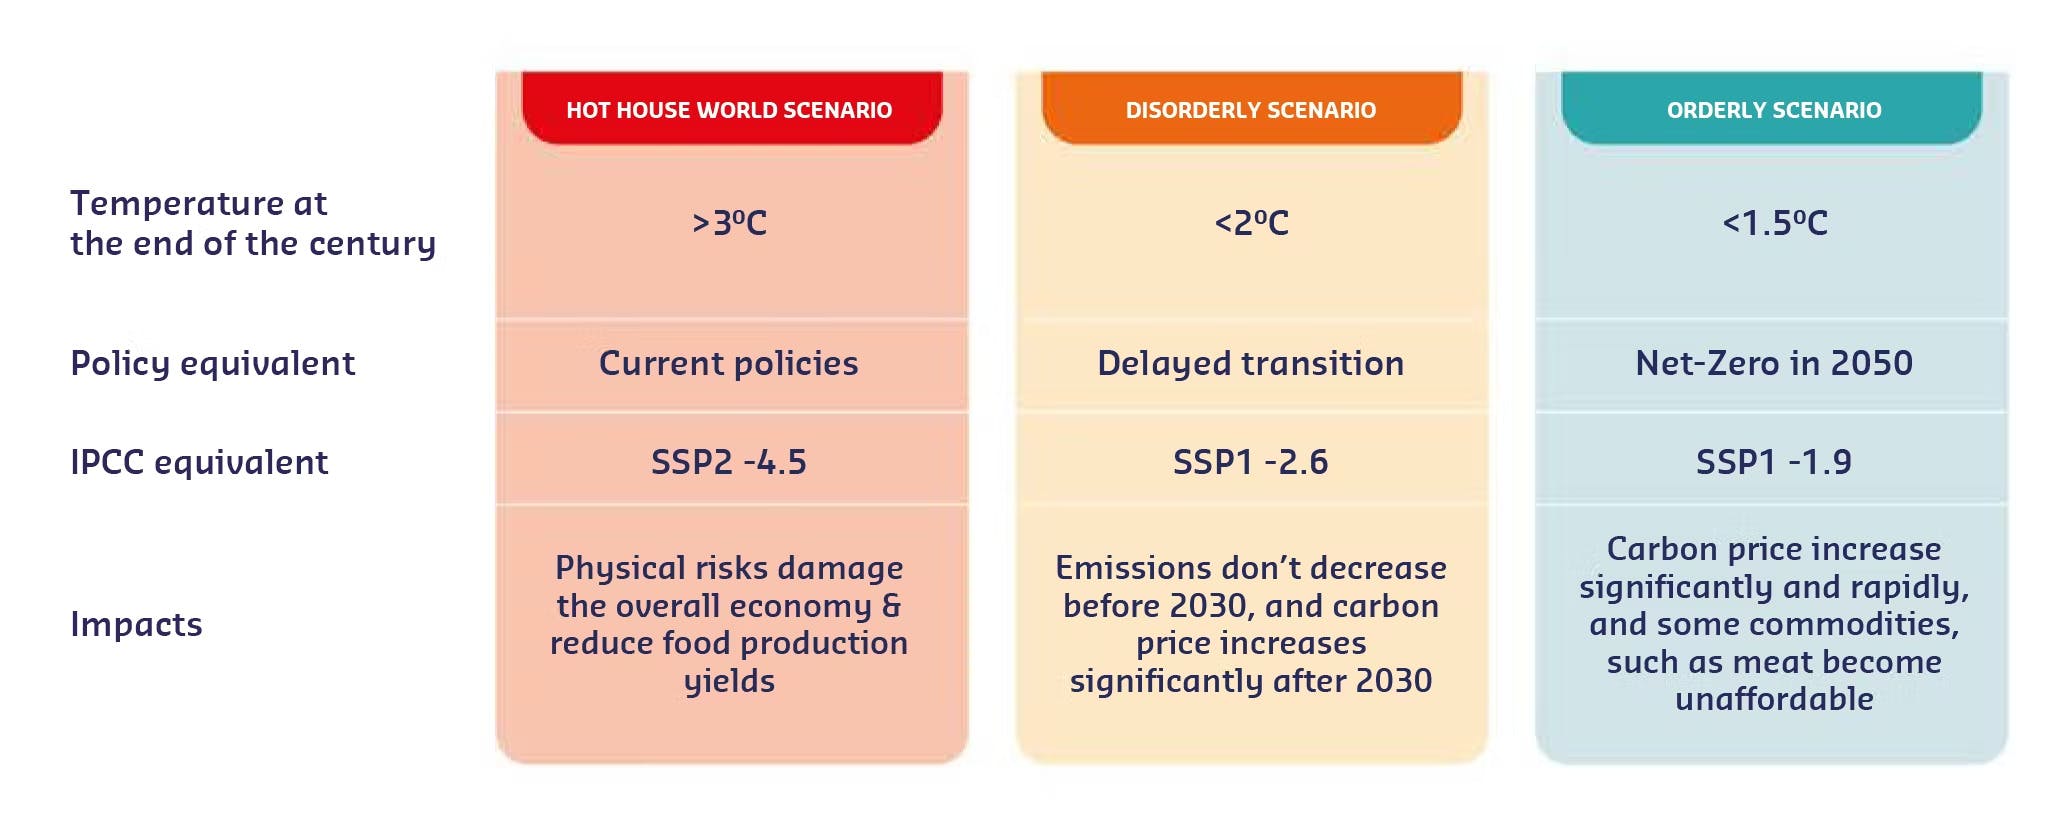
In Fiscal 2022, several Sodexo members from various continents, business areas and functions worked with external expert consultants to better identify and analyze the risks and opportunities created by climate change. This evaluation examined how Sodexo's current economic model would evolve under three Network for Greening the Financial System (NGFS) climate scenarios:
- the evaluation took place using a regional approach through the selection of a few key variables, such as carbon price, plant and animal based products cost, labor productivity, GDP, etc. and their short, medium and long-term evolution;
- this modeling showed that Sodexo’s business would be affected under each climate scenario if the risks were not mitigated, with a financial impact three times greater in the most catastrophic scenario than in the ideal scenario. This evaluation of scenarios allows us to identify the financial, commercial and strategic impacts, which helped us define the Group's next steps.

Hot house scenario
Temperature at the end of the century
More than 3°C
Policy equivalent
Current policies
IPCC equivalent
SSP2 -4.5
Impacts
Physical risks damage the overall economy & reduce food production yields
Disorderly scenario
Temperature at the end of the century
Less than 2°C
Policy equivalent
Delayed transition
IPCC equivalent
SSP1 -2.6
Impacts
Emissions don’t decrease before 2030, and carbon price increases significantly after 2030
Orderly scenario
Temperature at the end of the century
Less than 1.5°C
Policy equivalent
Net-Zero in 2050
IPCC equivalent
SSP1 -1.9
Impacts
Carbon price increase significantly and rapidly, and some commodities, such as meat become unaffordable

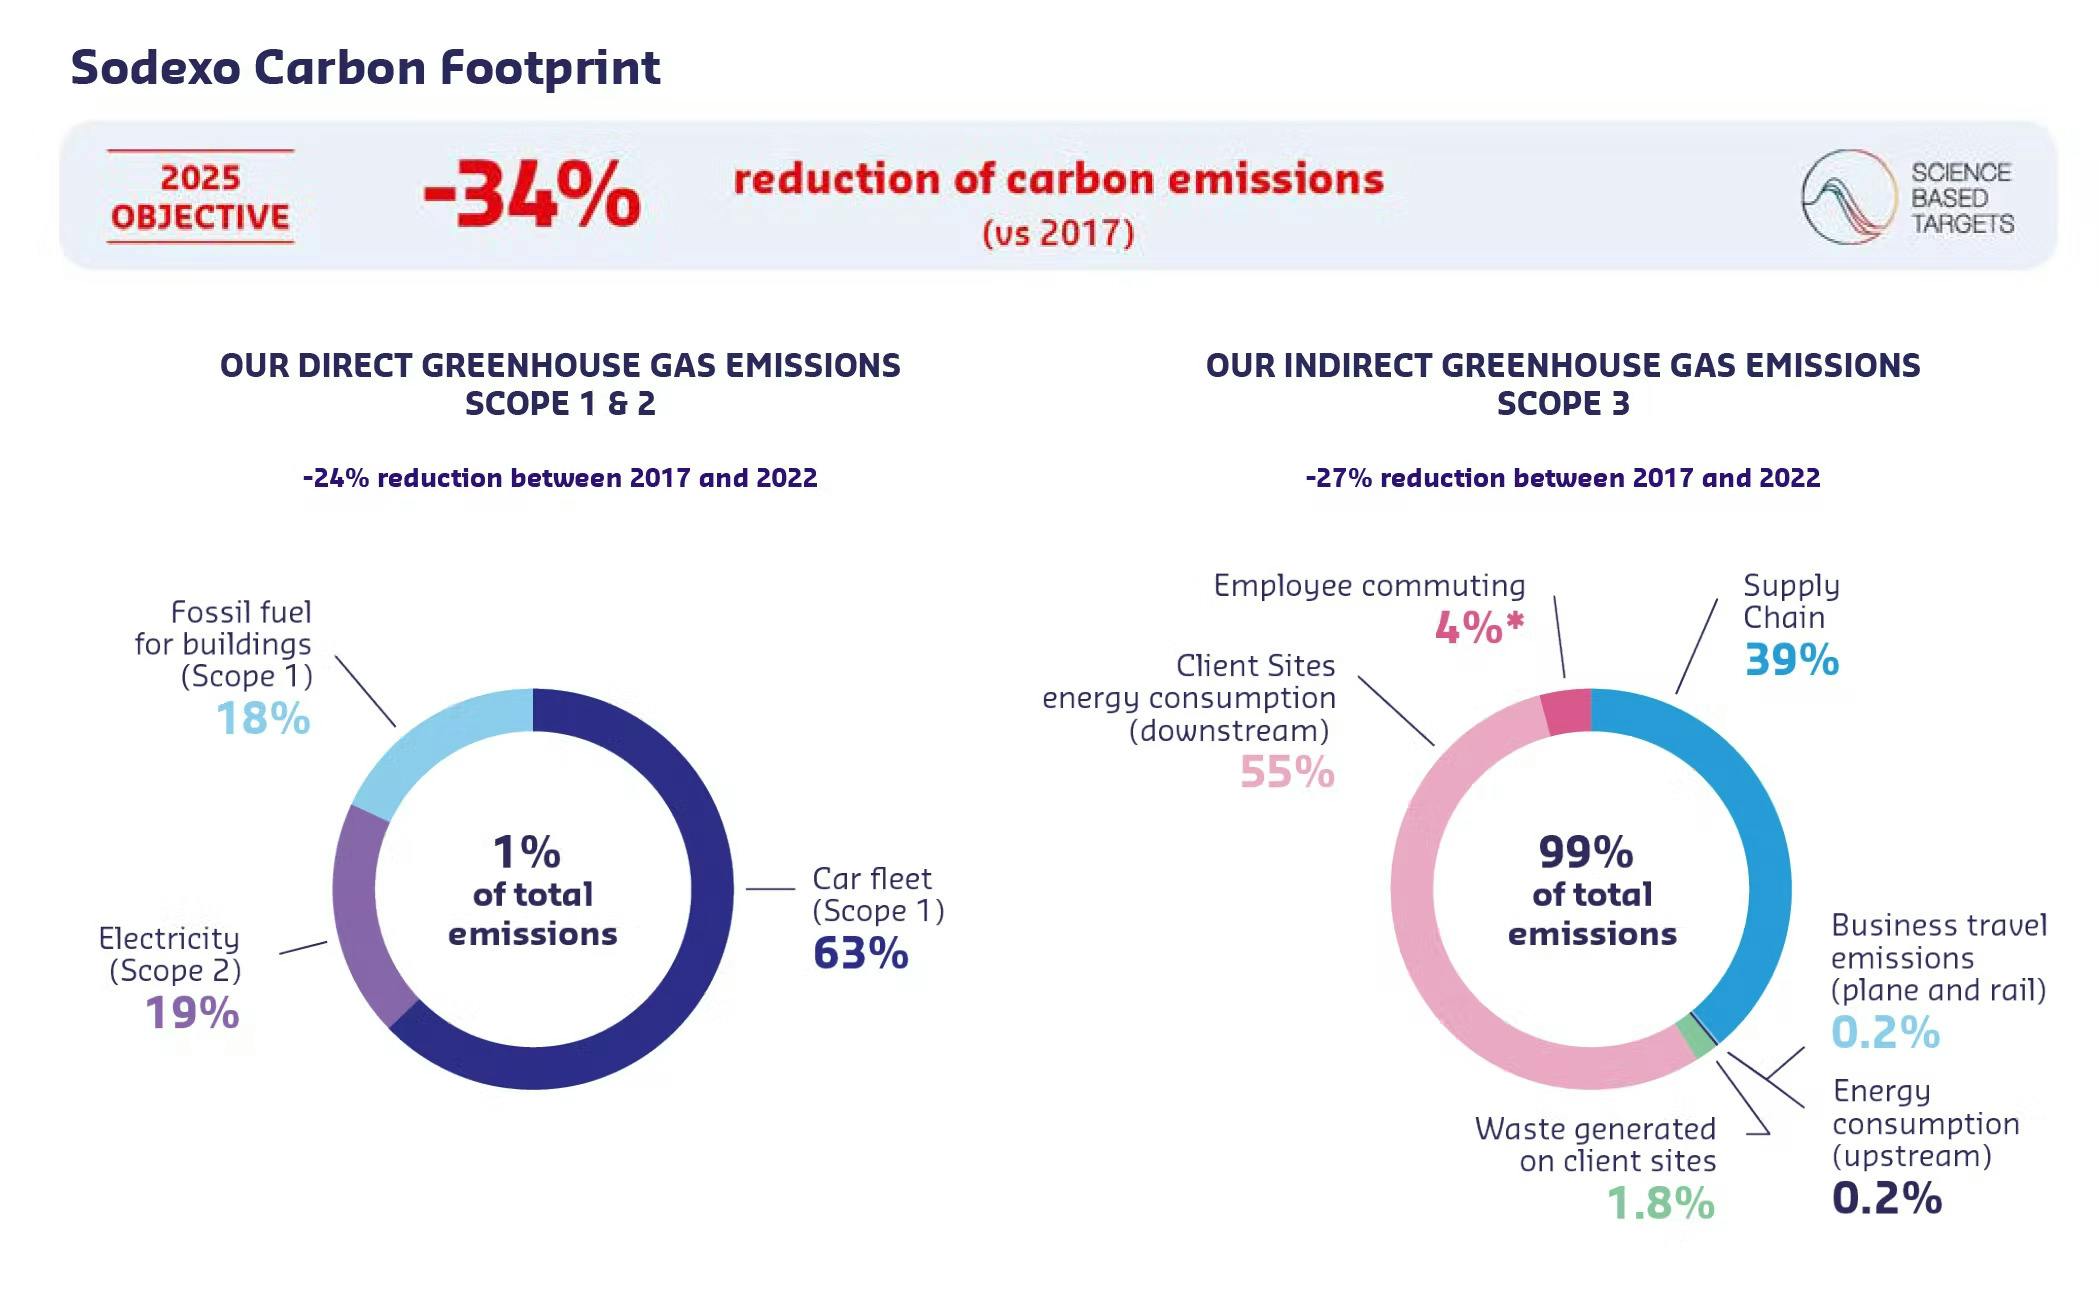
Sodexo carbon footprint
Objective 2025 : -34% reduction of carbon emissions vs 2017 (science-based targets)
The diagram shows our direct greenhouse gas emissions (scope 1 and 2)
-24% reduction between 2017 and 2022
1% of total emissions
- Fossil fuel for buildings (scope 1): 18%
- Electricity (scope 2): 19%
- Car fleet (scope 1): 63%
This diagram shows our indirect greenhouse gas emissions (scope 3)
-27% reduction between 2017 and 2022
99% of total emissions
- Client’s sites energy consumption (downstream): 55%
- Employee commuting: 4% *
- Supply chain: 39%
- Business travel emissions (plane and rail): 0.2%
- Energy consumption (upstream): 0.2%
- Waste generated on client sites: 1.8%
* Based on estimations.
