4.1.1 By business segment
| FISCAL 2022(in million euros) | ON-SITE SERVICES | BUSINESS & ADMINISTRATIONS | HEALTHCARE & SENIORS | EDUCATION | BENEFITS & REWARDS SERVICES | ELIMINATIONS AND CORPORATE EXPENSES | GROUP TOTAL |
|---|---|---|---|---|---|---|---|
| Revenues (third-party) | Revenues (third-party) ON-SITE SERVICES 20,263 |
Revenues (third-party)BUSINESS & ADMINISTRATIONS11,167 | Revenues (third-party)HEALTHCARE & SENIORS5,459 | Revenues (third-party)EDUCATION3,637 | Revenues (third-party) BENEFITS & REWARDS SERVICES 862 |
Revenues (third-party) ELIMINATIONS AND CORPORATE EXPENSES
|
Revenues (third-party) GROUP TOTAL 21,125 |
| Inter-segment sales (Group) | Inter-segment sales (Group) ON-SITE SERVICES
|
Inter-segment sales (Group)BUSINESS & ADMINISTRATIONS
|
Inter-segment sales (Group)HEALTHCARE & SENIORS
|
Inter-segment sales (Group)EDUCATION
|
Inter-segment sales (Group) BENEFITS & REWARDS SERVICES 3 |
Inter-segment sales (Group) ELIMINATIONS AND CORPORATE EXPENSES (3) |
Inter-segment sales (Group) GROUP TOTAL — |
| TOTAL REVENUES | TOTAL REVENUES ON-SITE SERVICES 20,263 |
TOTAL REVENUES BUSINESS & ADMINISTRATIONS11,167 |
TOTAL REVENUES HEALTHCARE & SENIORS5,459 |
TOTAL REVENUES EDUCATION3,637 |
TOTAL REVENUES BENEFITS & REWARDS SERVICES 865 |
TOTAL REVENUES ELIMINATIONS AND CORPORATE EXPENSES (3) |
TOTAL REVENUES GROUP TOTAL 21,125 |
|
Underlying operating profit* |
Underlying operating profit* ON-SITE SERVICES 926 |
Underlying operating profit* BUSINESS & ADMINISTRATIONS391 |
Underlying operating profit* HEALTHCARE & SENIORS352 |
Underlying operating profit* EDUCATION183 |
Underlying operating profit* BENEFITS & REWARDS SERVICES 248 |
Underlying operating profit* ELIMINATIONS AND CORPORATE EXPENSES (115) |
Underlying operating profit* GROUP TOTAL 1,059 |
*Including Group’s share of profit of companies accounted for using the equity method that directly contribute to the Group’s business and excluding other operating income and expenses.
| FISCAL 2021(in million euros) | ON-SITE SERVICES | BUSINESS & ADMINISTRATIONS | HEALTHCARE & SENIORS | EDUCATION | BENEFITS & REWARDS SERVICES | ELIMINATIONS AND CORPORATE EXPENSES | GROUP TOTAL |
|---|---|---|---|---|---|---|---|
| Revenues (third-party) | Revenues (third-party) ON-SITE SERVICES 16,687 |
Revenues (third-party)BUSINESS & ADMINISTRATIONS8,884 | Revenues (third-party)HEALTHCARE & SENIORS4,762 | Revenues (third-party)EDUCATION3,041 | Revenues (third-party) BENEFITS & REWARDS SERVICES 741 |
Revenues (third-party) ELIMINATIONS AND CORPORATE EXPENSES
|
Revenues (third-party) GROUP TOTAL 17,428 |
| Inter-segment sales (Group) | Inter-segment sales (Group) ON-SITE SERVICES
|
Inter-segment sales (Group)BUSINESS & ADMINISTRATIONS
|
Inter-segment sales (Group)HEALTHCARE & SENIORS
|
Inter-segment sales (Group)EDUCATION
|
Inter-segment sales (Group) BENEFITS & REWARDS SERVICES 3 |
Inter-segment sales (Group) ELIMINATIONS AND CORPORATE EXPENSES (3) |
Inter-segment sales (Group) GROUP TOTAL — |
| TOTAL REVENUES | TOTAL REVENUES ON-SITE SERVICES 16,687 |
TOTAL REVENUES BUSINESS & ADMINISTRATIONS8,884 |
TOTAL REVENUES HEALTHCARE & SENIORS4,762 |
TOTAL REVENUES EDUCATION3,041 |
TOTAL REVENUES BENEFITS & REWARDS SERVICES 745 |
TOTAL REVENUES ELIMINATIONS AND CORPORATE EXPENSES (3) |
TOTAL REVENUES GROUP TOTAL 17,428 |
|
Underlying operating profit* |
Underlying operating profit* ON-SITE SERVICES 486 |
Underlying operating profit* BUSINESS & ADMINISTRATIONS103 |
Underlying operating profit* HEALTHCARE & SENIORS310 |
Underlying operating profit* EDUCATION74 |
Underlying operating profit* BENEFITS & REWARDS SERVICES 186 |
Underlying operating profit* ELIMINATIONS AND CORPORATE EXPENSES (95) |
Underlying operating profit* GROUP TOTAL 578 |
*Including Group’s share of profit of companies accounted for using the equity method that directly contribute to the Group’s business and excluding other operating income and expenses.
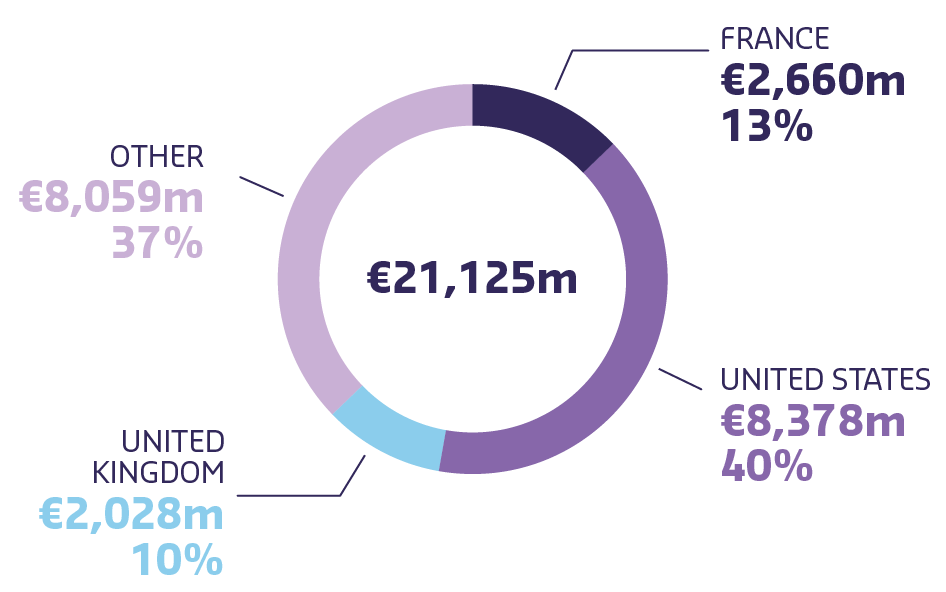
4.1.2 By significant country
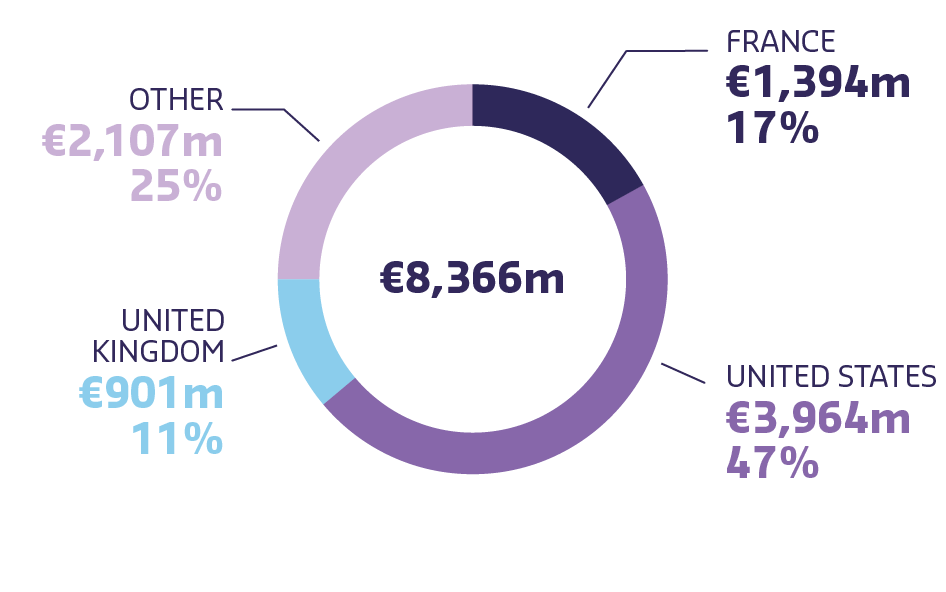
The Group’s operations are spread across 53 countries, including three that each represent over 10% of consolidated revenues in Fiscal 2022: France (the Group’s registration country), the United States and the United Kingdom. Revenues and non-current assets in these countries are as follows:
Revenue Fiscal 2022
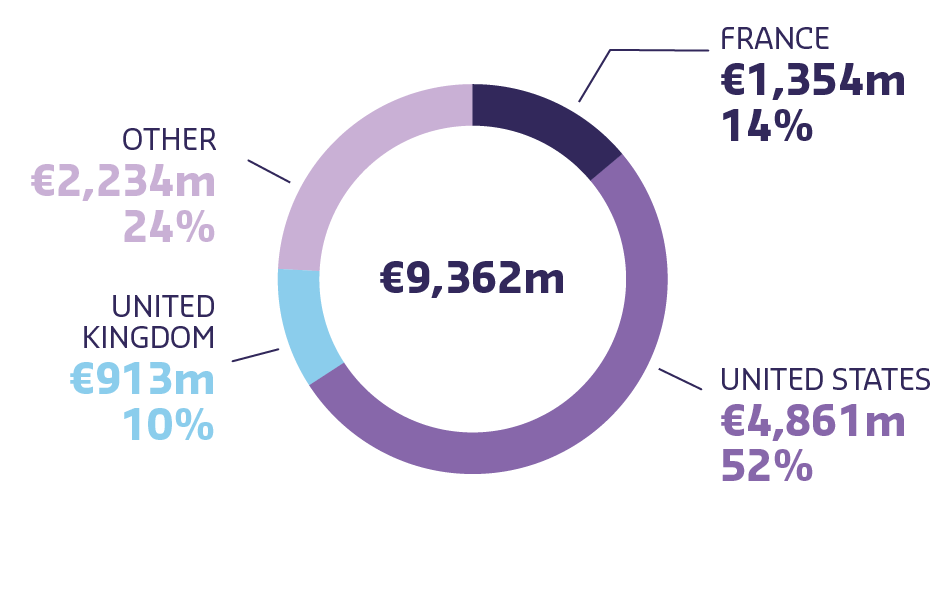
Non-current assets as of August 31, 2022
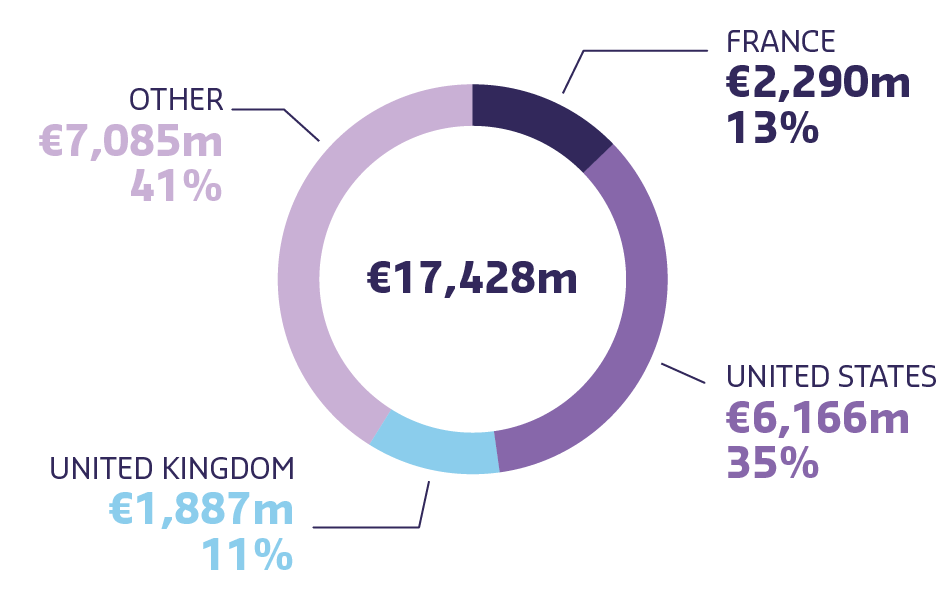
Revenue Fiscal 2021
Non-current assets as of August 31, 2021
Non-current assets are composed of goodwill, other intangible assets, property, plant and equipment, client investments and right-of-use assets relating to leases.